What is BACnet?

There is an abundance of real-time data flowing throughout our most common spaces — offices, hospitals, labs, schools, gyms and government buildings. Yet, most Engineers are unaware or unable to access this wealth of data and, thus, they miss valuable opportunities to improve their buildings.
So, where is this data?
Engineers can find this data moving across their building’s automation and control network. The name of that network communication protocol is BACnet [more technical details can be found here ASHRAE 135].
Much like we connect our personal computers to our wi-fi at home, the critical systems and arteries of a building are connected to a BACnet network. These systems include HVAC, Lighting, Occupancy Sensors, Elevators, Security, Fire, Safety and more.
Ok, what does this data look like?
Simply put, this data is a collection of present values and present logic from all the sensors that are bundled into the building’s existing equipment.
For example, a building’s Variable Air Volume system includes temperature sensors to enable its temperature control. These sensors and their present values, including the setpoint logic, are just one source of data. Similarly, an Elevator and its status, speed, power consumption and movement across floors is another source of data on the BACnet network.
Why is this data valuable to me?
Trend data is an evergreen spring of value. Engineers can use this data to pinpoint performance issues in real-time or arrange a ‘look-back’ each month. The Engineer that observes their Building’s Trends will catch obvious opportunities to improve tenant comfort, save money or fix broken equipment. These remedies improve tenants’ lives and the longevity of the building itself.
How can you examine this data?
The simplest method is to view a Trend. A Trend is simply a plot of sensor data points along an interval of time. Engineers and Technicians are already equipped with the knowledge of their specific building and expertise to view a Trend Line and identify an anomaly.
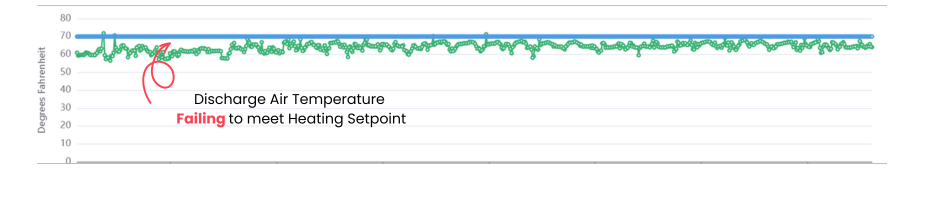
A straightforward example is viewing a Trend of temperature readings not conforming to setpoints. Experts know this misalignment is indicative of an underlying problem with control sequences or equipment failure, which you can bookmark for further investigation. Here is one such example viewable on the Onboard Smart Data Hub.
Where can I find data Trends for my buildings?
Most BACnet enabled buildings will have a building management software system installed (BMS/BAS, used interchangeably). This software is used to program the logic of the building’s systems and, given this critical function, it is best restricted to the Control Specialists or IT/OT Personnel.
Complementing the BMS however, is the Onboard Smart Data Hub, which is the data repository or data historian. The Smart Hub is the easiest way to store and view your Trend data. Onboard’s AI also standardizes your data making it easy to use your data despite multiple equipment makes, models, vintages and building geographies.