
Exporting Data
The Data Export feature on the Onboard Portal provides an easy way to export the time-series data collected from your buildings. You can export the data across all your buildings in a format that suits your needs, such as CSV or JSON files. The exported files can be used to quickly analyze your data with Excel, Python and many other applications. This guide will walk you through the process of creating an export.
To export data, you must have an Onboard Account, and time-series data from your building trending on the Onboard Portal. If you don’t have an account, talk to us to set it up.
Access the Data Export Page from the left-hand navigation bar on the Onboard Portal
On the top right of the page, click on the CREATE NEW EXPORT button to initiate a new export.
This will open a form where you can specify the details for your export.
Steps to Export Data
Note: The data export page limits all queries to 2 millions samples
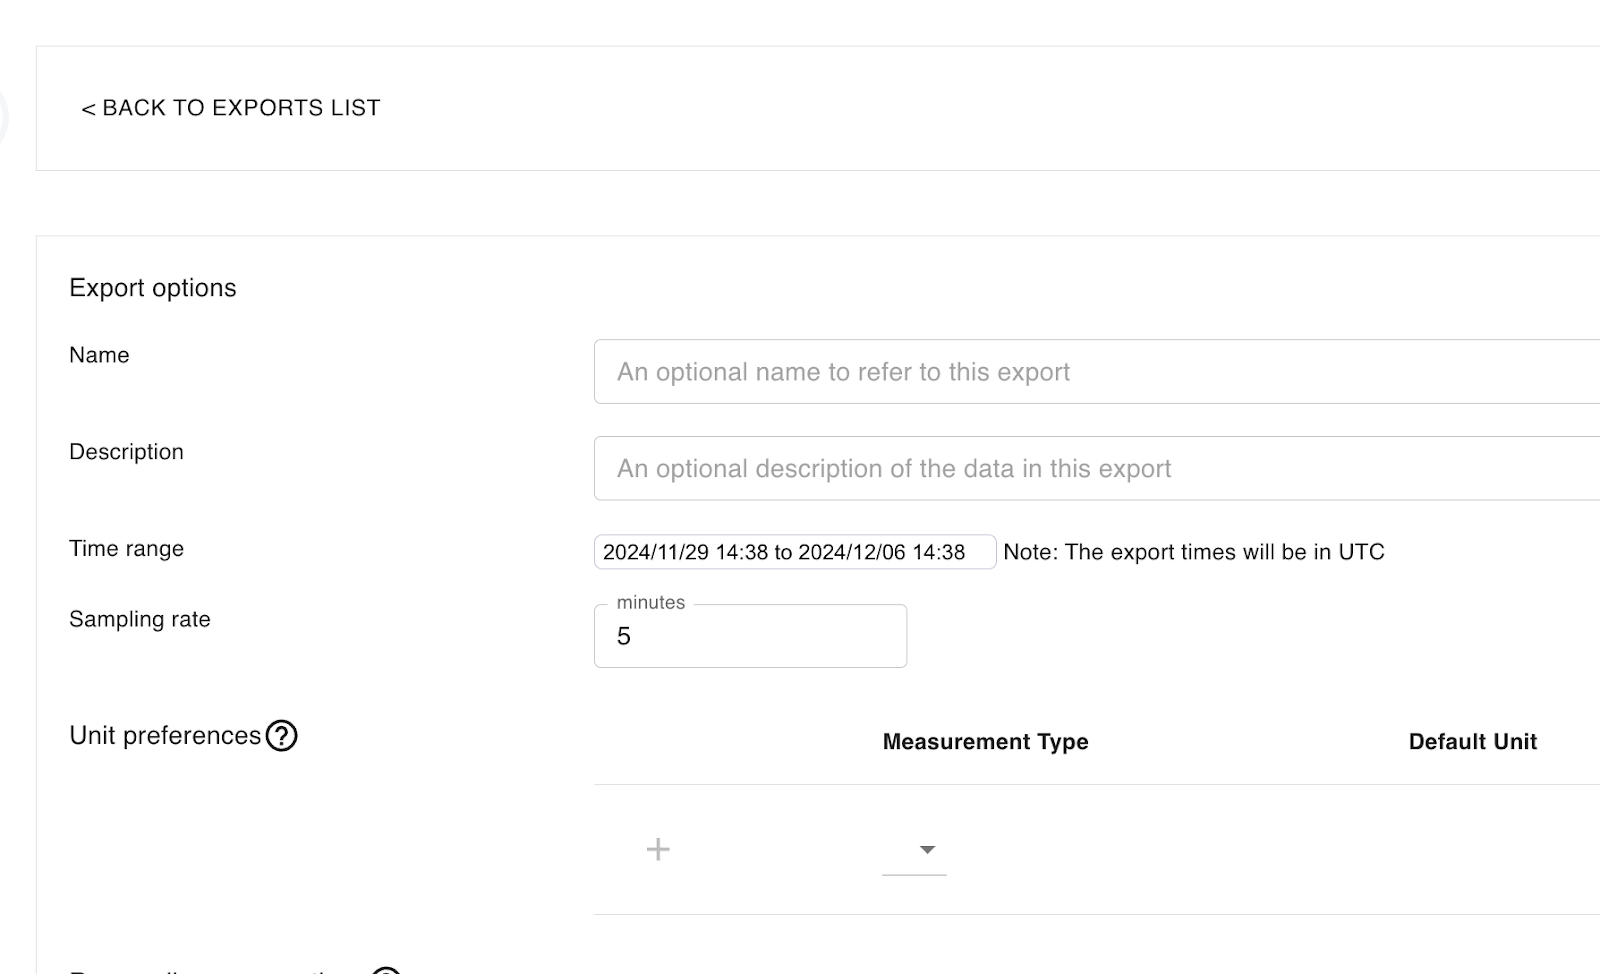
- Name and Description: Start by giving your export a name and a brief description for easy identification later.
- Time Range: Select the date and time range for your export. Note that the time selector is in UTC (Coordinated Universal Time), and the export will be in UTC as well. For instance, 12:00 PM UTC is 7:00 AM Central Time (CST) during standard time and 6:00 AM Central Time (CDT) during daylight saving time in the US.
- Sampling Rate: Choose the sampling rate for your data export: 5 minutes, 15 minutes, 60 minutes, or 1 day. Select the one that best fits your needs.
- Set Preferences (Optional): Fine-tune how your exported values are converted and summarized. Both settings are optional and apply per measurement type.
- Unit Preference: Override the default unit for a measurement type, for example exporting energy in BTU instead of the default kWh. To set your unit preference:
- Under Measurement Type, select the measurement to change. If you're unsure which measurement a point uses, check the Points List on the Data Model Page.
- Under Preferred Unit, choose the unit for the export.
- Click the ➕ icon to save the preference.
- Resampling Aggregation: Control how sampled data is summarized. For example, data collected every minute and exported at a 15-minute sampling rate is averaged for each interval by default.
- Under Measurement Type, select the measurement to change, then choose one of the following:
- Mean (default): Average of the values in the interval
- Min: Minimum value in the interval
- Max: Maximum value in the interval
- Sum: Sum of all values in the interval
- Click the ➕ icon to save the preference.
- Under Measurement Type, select the measurement to change, then choose one of the following:
- Unit Preference: Override the default unit for a measurement type, for example exporting energy in BTU instead of the default kWh. To set your unit preference:
- Data Selection: In this section, you will define the building data you want to export. The options will update dynamically as you make your way through the selection parameters. The parameters you can choose from include:
- Building Name
- Equipment Type
- Point Type
- Equipment (specific equipment names such as AHU-1, and VAV-101)
- Preview Your Export: Once you’ve set all your parameters, click Preview Query to see a summary of the data you are about to export.
- Choose Output Format: Select the output format for the export:
- CSV: Ideal for use in spreadsheets or further data analysis.
- JSON: Suitable for use with APIs or web applications that work with structured data.
- ND-JSON: Useful for exporting large datasets in a format that can be processed line by line.
- Export the Data: Finally, click EXPORT to begin downloading the time-series data file. The download will begin in the background. Depending on the size of the data, it may take anywhere from a few seconds to several minutes to complete.
Managing your Data Exports
Your export will be saved on the Data Export Page. You can create multiple exports with different preferences, equipment and points. If you need to export the same data again with a different time range in the future, you can return to the page and continue from where you left off.